How many people – health workers, citizens, and government staff – have been trained in HIV prevention and treatment in Ghana in the past 10 years? Although this may seem like a simple question, arriving at an accurate number is a monumental task. Even within a single donor organization, tracking and totaling outputs such as these may be difficult due to the breadth of operations and different reporting timings and mechanisms. At Development Gateway our Results Data Initiative is attempting to answer questions like these across organizations, locations, and time periods in order to offer a clearer picture of development results.
But first, why do we need a clearer picture? In a word: management. At both national and local levels, good data is essential for making plans. Health clinics, for example, need information on medicines and materials in order to make requests. District officials need information about individuals and institutions to determine optimal resource allocation. National governments need information on geographic distributions and donor activities to create budgets and define implementation strategies – the list goes on.
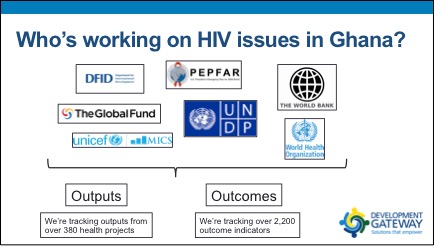
We explore the question of “how many HIV-related trainings occurred in Ghana” to demonstrate what we can do with machine-readable, linked-up results data. But the answer to this question – and questions like it – could help government and donors assess collective progress, consider the appropriateness of future interventions, avoid duplication, or coordinate more effectively. Our goal is to make linked-up results data available and demonstrate how it can be used for purposes like these. So, how many people have been trained in HIV prevention and treatment in Ghana in the past 10 years? We start by determining the main players in HIV/AIDS:

From the donors pictured above and others we track both output and outcome information. Eventually, these two data types will be linked together to get a more comprehensive view of the overall impact of donor activities. For now, we’ll focus on the output information in order to answer our question about trainings.
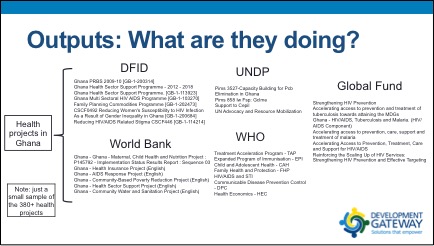
Once we have identified the appropriate organizations, we figure out all of the relevant projects they have conducted, as follows:

From by-donor project lists, we download all project documentation. Although sometimes donors report project outputs in spreadsheets or other structured databases, this is extremely rare. Output information is usually found in PDF project documents that are used for internal reporting. In the best cases, these are standardized reports such as the World Bank’s Implementation Completion and Results Report. In the worst cases, donors may simply list outputs within a project summary or may not report outputs publically at all. We do our best to extract as much data as we can in each case.
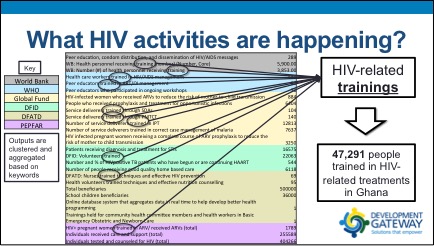
Now that we have all the relevant project documents, we focus in on HIV-related projects by searching for HIV keywords:

Within HIV-classified projects, output information is scraped by machines and manually (it’s a big job). This task highlights the importance of better-standardized project reports—if our community wants to understand and consider development results, we need easier access to results data. Machine learning algorithms can quickly and accurately pull information from standardized documents. But since most output information is not currently found in structured reports, “output scraping” is an arduous process.

But we persevered, and can now offer a comprehensive view of happenings on the ground. In HIV/AIDS, donors engage in a host of different activities in order to raise awareness and treat the disease. By searching through these output indicators for keywords, we can cluster outputs into distinct groups. In our example, training-related keywords are our area of interest.

Now, at long last, we have arrived at our answer: 47,291 people have been trained in HIV-related treatments in Ghana in the past 10 years.
Producing this number with data sourced from multiple donors and reporting types represents a significant step forward for the ways we can aggregate and use development data. But we still have a lot to do. Obviously this is just a look at data that is publicly available, so many non-published activities have probably been left out. Better geographic information is another important consideration, since we cannot say much yet about the spatial distribution of these 47,000+ trainings. Additionally, we will want to link these outputs with subnational outcome information in order to track the influence of these trainings and other similar activities.
Our initiative aims to aggregate more data that can answer more questions like this one, and we hope you’ll keep learning with us. We’re also speaking with hundreds of government, donor, and NGO staff to figure out how better (and shareable) data can be used to inform their work.
But more broadly, as the development community seeks to adopt and adhere to open data policies, it is important that project reports be among the standardized documents or datasets posted online. If your data is missing, reach out to our Data Crosswalk Team with more results information. We’ll continue to show that specific answers relevant to planning and management are possible, even amidst the large, complicated world of donor results data.

